After completing this lesson, learners should be able to:
Project multi-dimensional image data into lower dimensions
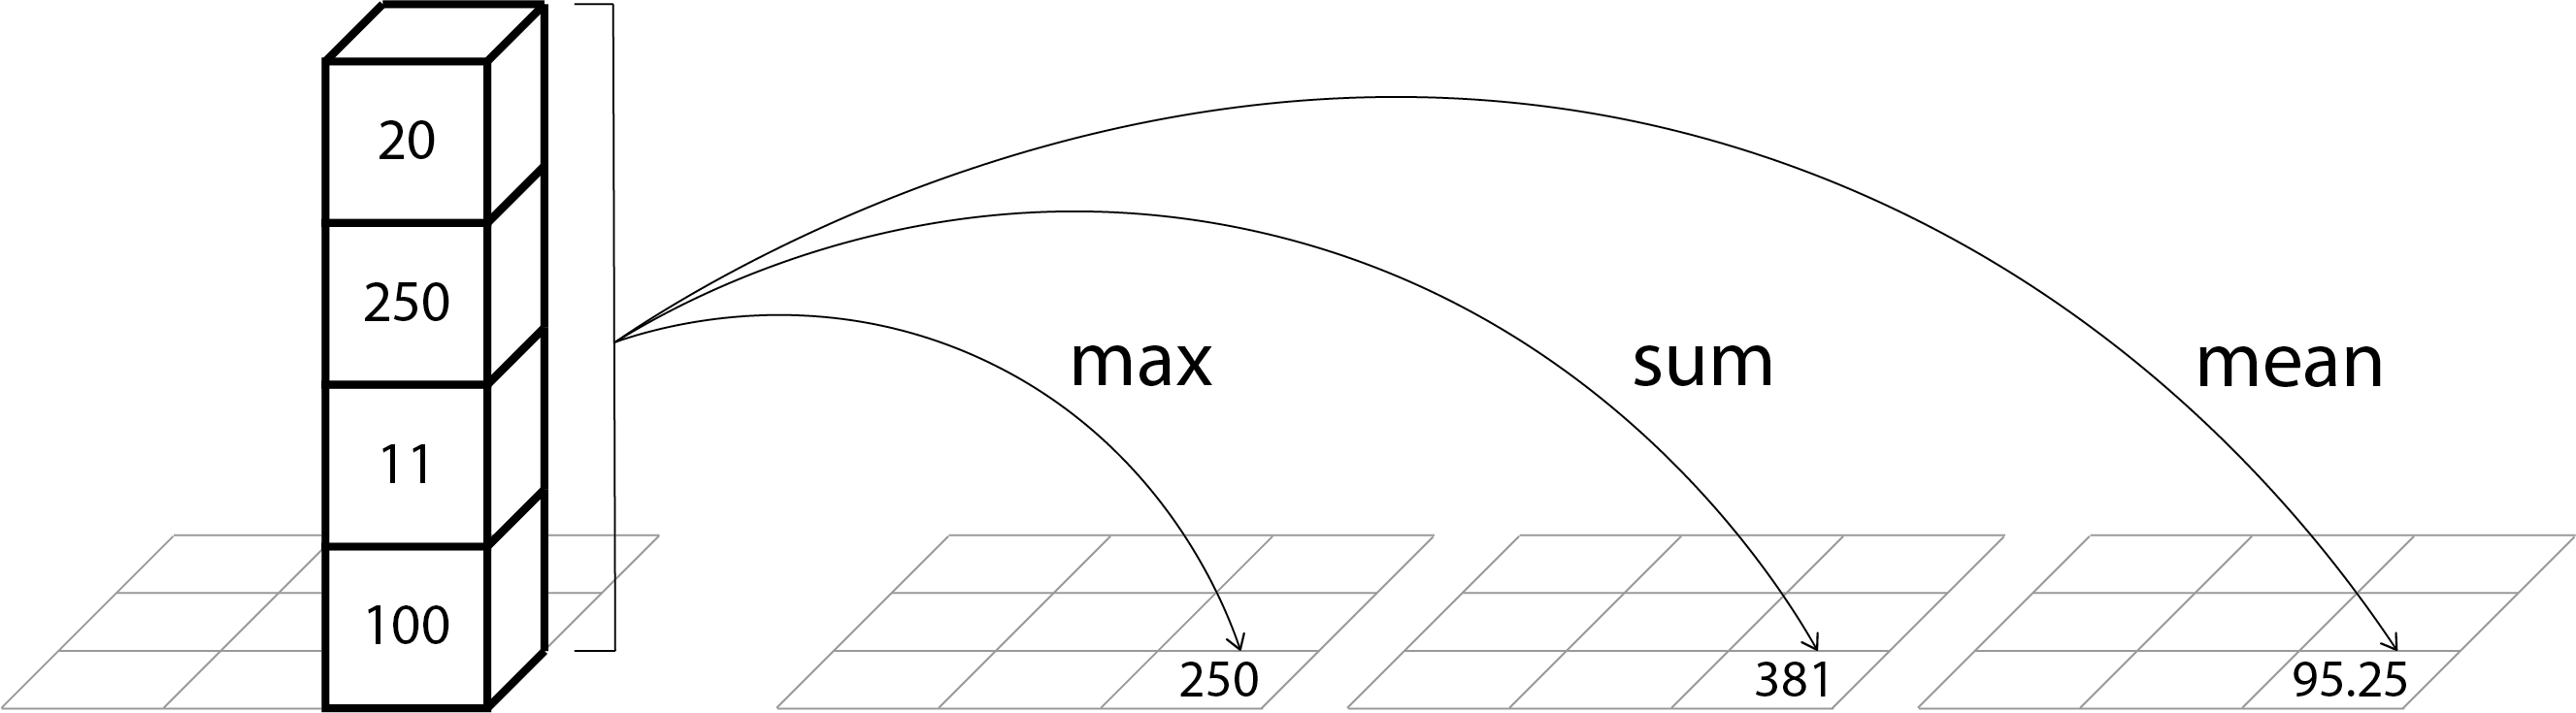
Understand the differences between projection modes such as max, sum, and mean
Motivation
Viewing image data that has more than two dimensions is difficult, because computer monitors are 2-D.
Thus, it often is very useful to project the data into a 2-D representation.
Of course, doing such a projection will loose information. Thus, performing projections without compromising the scientific
integrity of the data is not easy and should only be done with a sufficient understanding of the various methods.
This 3-D image contains sparse dot-like fluorescence signals
Observe that viewing the data in 3-D is somewhat challenging
Perform a maximum projection along the z-axis to “see all spots at once”
Discuss under which circumstances the number of dots in the projection equals the total number of spots in 3-D
Also perform a sum projection and discuss why this is may be better than a maximum projection in terms of quantifying the total signal contained in the spots
Understand that the data type of a sum projection typically needs to be “larger” than the input data
Also learn how to project along the x or y axis
Understand that projections along the x or y axis typically yield anisotropic images (due to an initial xy/z anisotropy)
Resample or rescale the x and y projections for correct appearance in physical space
Appreciate that the data type of the sum projection is different to the original image.
Discuss whether the data type change was necessary in this specific case.
X and Y axis projection
There is no easy way to project along the x or y axis in ImageJ.
We need to rearrange the stack such that the new z axis is the one along which to project.
Maximum projection along x axis
run("Reslice [/]...", "start=Left avoid");
Left/Right/Top/Bottom = as if looking from the left(east)/right(west)/top(north)/bottom(south) onto the stack on your screen (Top does not mean to look on the stack from the top as in along the z-direction).
[X] avoid interpolation (otherwise it will create new pixels by interpolation)
The output spacing argument will be ignored if we do not interpolate.
Note that the image has the same number of pixels, but rearranged.
Note that also the voxel sizes run("Properties..) have changed.
Notice that the images do not look correct in a physical sense, but squashed.
This is due to a mismatch of the data (voxel) space and physical space.
Select one of the projected (x or y axis) images
run("Properties...")
Observe that the voxel sizes are correct, but the ImageJ viewer does not take them into account for rendering.
Opening the same image in BigDataViewer paints a different picture: [ Plugins > BigDataViewer > Open Current Image…]
Resampling (optional)
To achieve a more correct appearance in physical space in the ImageJ viewer we need to up-scale the image and add more voxels. Note that while this is good for visualization, it does change the data and should thus be done with care.
Compute the scaling factor: 0.4 / 0.0941345 = 4.249239
Rescale the x-projection: run("Scale...", "x=1.0 y=4.249239 z=1.0 interpolation=None average create");
Rescale the y-projection: run("Scale...", "x=4.249239 y=1.0 z=1.0 interpolation=None average create");
ImageJ GUI CLIJ2
Install CLIJ2
In ImageJ one can project along the z axis (e.g. [Image > Stacks > Z Project …]), but there is no easy way to project
along the x or y axis. Thus let’s install the very useful update site: CLIJ2.
Drag and drop above link onto Fiji or [File > Import > URL…]: https://github.com/NEUBIAS/training-resources/raw/master/image_data/xyz_16bit__spots.tif
Z axis projection
Sum projection: [Plugins › ImageJ on GPU (CLIJ2) › Projections › Sum-Z-projection on GPU]
Maximum projection: [Plugins › ImageJ on GPU (CLIJ2) › Projections › Max-Z-projection on GPU]
Compare the pixel values and data types of the two images.
Appreciate that the data type of the sum projection is different from that of the original image.
Discuss whether the data type change was necessary in this specific case.
X and Y axis projection
Maximum projection x: [Plugins › ImageJ on GPU (CLIJ2) › Projections › Max-X-projection on GPU]
Maximum projection y: [Plugins › ImageJ on GPU (CLIJ2) › Projections › Max-Y-projection on GPU]
Appearance of anisotropic images
Notice that the x and y projected images do not look correct in a physical sense, but squashed.
This is due to a mismatch of the data (voxel) space and physical space.
Select one of the projected (x or y axis) images
run("Properties...")
Observe that the voxel metadata is not maintained by CLIJ2
For y projection change the image properties to width = 0.0941345 and height = 0.4
For x projection change the image properties to width = 0.4 and height = 0.0941345
Observe that even with correct voxel size the ImageJ viewer does not take them into account for rendering.
Opening the same image in BigDataViewer paints a different picture: [ Plugins > BigDataViewer > Open Current Image…]
Resampling (optional)
To achieve a more correct appearance in physical space in the ImageJ viewer we need to up-scale the image and add more voxels.
Note that while this is good for visualization, it does change the data and should thus be done with care.
Compute the scaling factor: 0.4 / 0.0941345 = 4.249239
Rescale the x-projection: run("Scale...", "x=1.0 y=4.249239 z=1.0 interpolation=None average create");
Rescale the y-projection: run("Scale...", "x=4.249239 y=1.0 z=1.0 interpolation=None average create");
Appreciate that the data type of the sum projection is different to the original image.
Discuss whether the data type change was necessary in this specific case.
X and Y axis projection
There is no easy way to project along the x or y axis in ImageJ.
We need to rotate the stack such that the new z-axis is the one along which to project.
For rotating we use TransformJ, which has many useful functions for dealing with 3D data.
This requires the very useful update site: ImageScience.
Notice that the images do not look correct in a physical sense, but squashed.
This is due to a mismatch of the data (voxel) space and physical space.
Select one of the projected (x or y axis) images
run("Properties...")
Observe that the voxel sizes are correct, but the ImageJ viewer does not take them into account for rendering.
Opening the same image in BigDataViewer paints a different picture: [ Plugins > BigDataViewer > Open Current Image…]
Resampling (optional)
To achieve a more correct appearance in physical space in the ImageJ viewer we need to up-scale the image and add more voxels. Note that while this is good for visualization, it does change the data and should thus be done with care.
Compute the scaling factor: 0.4 / 0.0941345 = 4.249239
Rescale the x-projection: run("Scale...", "x=1.0 y=4.249239 z=1.0 interpolation=None average create");
Rescale the y-projection: run("Scale...", "x=4.249239 y=1.0 z=1.0 interpolation=None average create");
skimage napari
# %%
# Explore Max and Sum Projections
# %%
# Import python packages
fromOpenIJTIFFimportopen_ij_tiffimportnumpyasnpfromnapari.viewerimportViewerfromskimage.transformimportrescale# %%
# Open a 3D image and inspect its metadata
image,axes,scales,units=open_ij_tiff("https://github.com/NEUBIAS/training-resources/raw/master/image_data/xyz_16bit__spots.tif")print(image.shape)print(axes)print(scales)print(units)# %%
# As this is an anisotropic image, we view it scaled
# - Napari: Use 3-D rendering see all the spots
viewer=Viewer()viewer.add_image(image,scale=scales)# %%
# Create and view a maximum projection along z-axis, i.e. axis = 0
# - Observe how the maximum gives a nice "quick overview" of the data content
# - In order to see it at the same scale as the original image we need to scale in in x&y
# - Napari: Observe that the image layer context menu also allows one to create projections
# - Napari: *Toggle grid mode (Ctrl + G)* to view images side by side
max_z_image=np.max(image,axis=0)viewer.add_image(max_z_image,scale=[scales[1],scales[2]])# %%
# Compute sum projection along z-axis
# and display it in napari
# - Napari: There is an an issue rendering the sum projection pixel values: some high values appear dark. More details and a possible work-around is given at the end of this script.
sum_z_image=np.sum(image,axis=0)viewer.add_image(sum_z_image,scale=[scales[1],scales[2]])# %%
# Observe that the data type changed during the sum projection
# but not during the maximum projection
# - Understand why this make sense
print("orig:",image.dtype)print("max projection:",max_z_image.dtype)print("sum projection:",sum_z_image.dtype)# %%
# Compute the maximum value that could occur during a sum projection of this image
# and compare this to what it actually is and what would be supported by
# the data type of the sum projection
max_per_slice=np.iinfo(image.dtype).maxnum_slices=image.shape[0]max_sum_value=num_slices*max_per_sliceprint("max sum value that could occur for this image:",max_sum_value)print("actual max sum value in this image:",sum_z_image.max())print("max sum value supported by projection:",np.iinfo(sum_z_image.dtype).max)# %%
# Compute maximum projection along x-axis and y-axis
# and show in viewer with correct scaling
max_x_image=np.max(image,axis=2)max_y_image=np.max(image,axis=1)viewer.add_image(max_x_image,scale=[scales[0],scales[1]])viewer.add_image(max_y_image,scale=[scales[0],scales[2]])# %%
# Optional work-around for the above mentioned issue when rendering
# certain data types (https://github.com/NEUBIAS/training-resources/issues/570)
# Convert sum projection to float to properly visualize it
sum_z_image_float=sum_z_image.astype(float)viewer.add_image(sum_z_image_float,scale=scales[1:3])# %%
# Close the viewer (CI test requires this)
viewer.close()
What is the highest pixel value in the y sum projection?
You should find that the value for the y axis is higher, explain why this could be expected from the morphology of the golgi in the original image.
What would you expect for doing above exercise with maximum projections? Also two different values or two times the same value?
Answers
The highest value in the z sum projection is 94558.
The highest value in the y sum projection is 165401.
The Golgi is elongated along the y axis, thus a sum projection adds up a lot of high values along this axis.
For maximum projections you would expect the same value.
ImageJ GUI CLIJ2
Install CLIJ2
In ImageJ one can project along the z axis (e.g. [Image > Stacks > Z Project …]), but there is no easy way to project
along the x or y axis. Thus let’s install the very useful update site: CLIJ2.
Sum projection: [Plugins > ImageJ on GPU (CLIJ2) > Projections > Sum-Z-projection on GPU]
What is the highest pixel value in the z sum projection? (use e.g. [Analyze > Histogram])
Y axis projection
Sum projection: [Plugins > ImageJ on GPU (CLIJ2) > Projections > Max-Y-projeciton on GPU]
What is the highest pixel value in the y sum projection?
You should find that the value for the y axis is higher, explain why this could be expected from the morphology of the golgi in the original image.
What would you expect for doing above steps with maximum projections? Also two different values or two times the same value?
Answers
The highest value in the z sum projection is 94558.
The highest value in the y sum projection is 165401.
The Golgi is elongated along the y axis, thus a sum projection adds up a lot of high values along this axis.
For maximum projections you would expect the same value.
Assessment
Fill in the blanks
A projection ___ the number of dimensions in an image.
The pixel values in a sum projection will typically be much ___ than in a mean projection.
If you have an unsigned 8-bit image with dimensions x=10, y=10, z=5; the highest value that you can possibly get in a maximum projection along the z axis is ___?
Same image as above, the highest value you could possibly get in a sum projection along the z axis is ___?
Same image as above, the highest value you could possibly get in a sum projection along the x axis is ___?
Same image as above, the highest value you could possibly get in a mean projection along the y axis is ___?
Solution
decreases
larger
255 (highest value in a unsigned 8-bit image)
5 * 255 = 1275
10 * 255 = 2550
10 * 255 / 10 = 255
True or False
Image projections are always along the z-axis.
The data type of the projected image must be the same as the data type of the original image.
Solution
False, you can project along any axis.
False, in sum projections the pixel values are larger than in the original data and a different data type might
be needed to represent them. For maximum projections however the data type needs not be changed.
For mean projections it depends on the accuracy your science requires (decimal places need a floating point data type, 32-bit in IJ).